|
|
|
|
Wavefront construction using waverays |
In the waveray method, the wavelength-dependent
averaging of the velocity is done dynamically as a function
of the position and orientation of the plane wavefronts.
The velocity
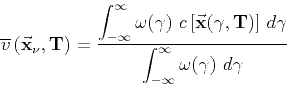
averaging is done using a Gaussian weight curve, centered at the wavepath
location (see Figure 1). Equation 1 expresses the
wavelength averaged velocity ![]() at a point
(
at a point
(
![]() ) for a wave period
) for a wave period ![]() (Lomax, 1994),
(Lomax, 1994),
(
![]() ) is the position along the
instantaneous straight wavefront given by the recursive relation
(Lomax, 1994):
) is the position along the
instantaneous straight wavefront given by the recursive relation
(Lomax, 1994):
The discrete representation of equation 1 is given
by equation 4:
These two equations are the discrete version of equation 3, but,
the dependence on the wavelength has been made explicit.
Notice that the subscript ![]() of
of
![]() runs along the wavepath and the
superscript
runs along the wavepath and the
superscript ![]() runs along the wavefront.
runs along the wavefront.
![]() specifies the largest distance in wavelengths along
the wavefront at which smoothing is applied.
specifies the largest distance in wavelengths along
the wavefront at which smoothing is applied.
The discrete equivalent of the Gaussian weight function is:
The motion of the waverays along the direction of propagation
is expressed by the following equation:
|
lomax2
Figure 2. Waveray wavepath calculation. Huygen's principle is used to obtain the bending |

|
|---|---|
|
|
The change in direction of the waverays is approximated by the
difference in movement between the first control point on either
side of the wave location
![]() as shown in
Figure 2:
as shown in
Figure 2:
Finally, the half width parameter ![]() and the truncation
parameter
and the truncation
parameter ![]() are set at
are set at ![]() and
and
![]() , based on Lomax (1994)
calibration. The number of control points
, based on Lomax (1994)
calibration. The number of control points ![]() is set
proportional to the ratio
is set
proportional to the ratio ![]() of the wave period over the
time step.
of the wave period over the
time step.
Figure 3 shows the significant differences between the waveray and ray methods. Notice how a high frequency ray is scattered by the small velocity anomaly, while the waveray's wavepath is little deflected. Note also, how the third ray (from right to left) is not perturbed by the low velocity anomaly, while the waveray wavepath is deflected. The wavelength-dependent velocity averaging smoothes out small velocity variations and causes the wavepath to be affected from velocity variations away from it.

|
|---|
|
lomaxsbs
Figure 3. Left frame shows a fan of high frequency ray paths. Right frame shows a fan of 12 Hz waveray wavepaths. The straight segments perpendicular to the waverays represent the instantaneous wavefronts. The velocity model is defined by two circular anomalies drawn in a homogeneous background. The black dot (located at 1000 m. by 1250 m. in depth) depicts a low velocity anomaly. The white circle a high one. |
|
|
|
|
|
|
Wavefront construction using waverays |
![\begin{displaymath}
\overline{v} (\vec{\bf x}_{\nu},{\bf T\/}) = \frac{
\dis...
... n}({\bf T\/})] }
{\displaystyle \sum_{n=-N}^{N}
\omega_{n}}
\end{displaymath}](img23.png)

