|
|
|
|
Missing log data interpolation and semiautomatic seismic well ties using data matching techniques |
Next: Performing a blind well Up: Validation by interpolation of Previous: Interpolation using predictive painting


|
|---|
|
seismic,dipc1,dipc2
Figure 17. (a) Phase adjusted seismic amplitude data. (b) Inline dip and (c) Crossline dip estimated using plane-wave destruction filters. |
|
|
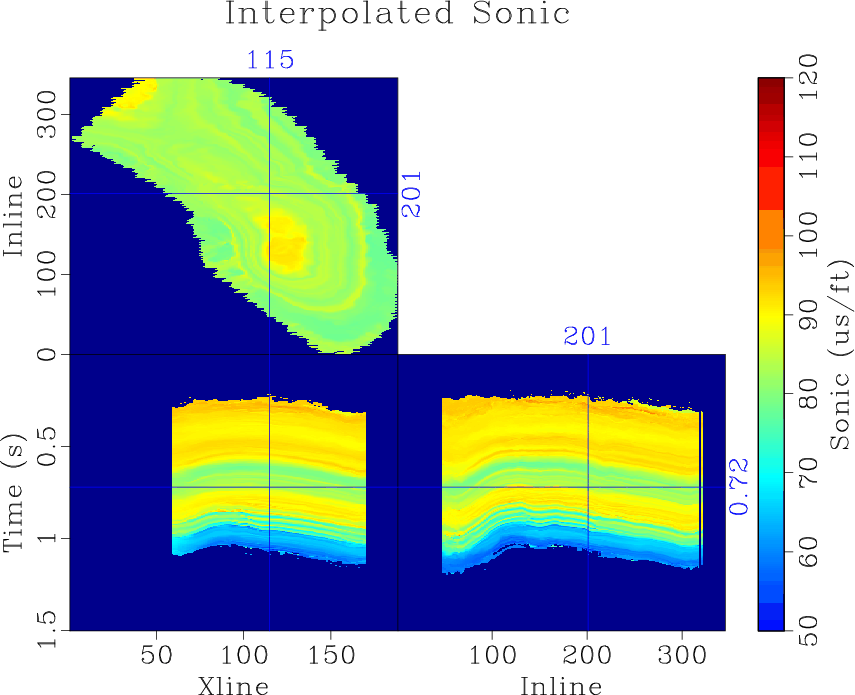
The reflection dip is used in the predictive painting algorithm and the RBF interpolant from Equation 18 to generate global log property volumes. The inputs to the interpolated sonic volume are the original sonic log interpolated to time using a TDR updated from shifts estimated using four iterations of LSIM matching. The results from interpolating sonic logs from 26 well is shown in Figure 18a. We observe reasonable lateral continuity along seismic structures indicating there are no significant misties between well and seismic data. Similarly to the interpolated sonic volume, the interpolated density volume shown in Figure 18b has reasonable lateral continuity along seismic structures and shows no evidence of a mistie. Qualitative interpretation of these results suggests that the estimated well ties are laterally consistent.


|
|---|
|
DTvol,RHOBvol
Figure 18. (a) Interpolated sonic and (b) interpolated density based on logs from 26 wells and the interpolant described in Equation 18. Note that the interpolated log data follows the seismic structure. |
|
|