|
|
|
|
Missing log data interpolation and semiautomatic seismic well ties using data matching techniques |
Next: Discussion Up: Computing log property volumes Previous: Computing log property volumes
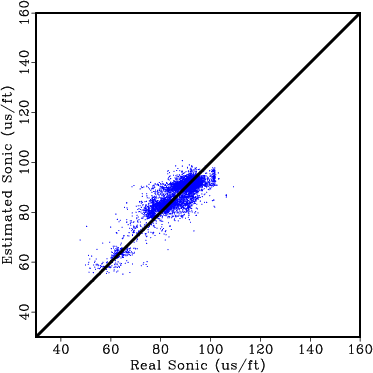
To understand the accuracy of all seismic well ties, we proceed to perform blind well tests at each well using the remaining wells as input. Results of the actual versus predicted sonic at all 26 wells are crossplotted in Figure 20.


|
|---|
|
bwtDT3,bwtDT6
Figure 19. Predicted (green) and actual (black) sonic logs from two different wells using a blind well test. The predicted and actual sonic logs match along the entire length of the well log indicating consistency in seismic well ties. |
|
|

|
|---|
|
xbwt-DT
Figure 20. Real sonic log cross plotted against the predicted sonic log from the blind well test for all 26 wells. Each blind well test used the remaining 25 wells as input. |
|
|
The results shown in Figure 20 indicate the predicted sonic matches reasonably well with the real sonic at all 26 wells giving us confidence that all seismic well ties are consistent and the resulting TDR for each well accurately maps the logs from depth to time.